


Fibonacci for stock
Audax developmentFibonacci for stock의 설명
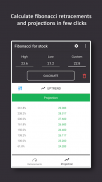
Play 스토어에서 1 위 피보나치 계산기
이제 몇 번의 클릭만으로 피보나치 되돌림 및 투영을 계산할 수 있습니다
피보나치 귀환은 기술 트레이더들에게 인기있는 도구이며 13 세기 수학자 레오나르도 피보나치가 식별 한 주요 수치를 기반으로합니다.
기술적 분석에서 피보나치 되돌림은 주식형 차트에서 두 개의 극단 점 (일반적으로 주요 피크 및 최저점)을 취하고 수직 거리를 23.6 %, 38.2 %, 50 %, 61.8 % 및 100의 주요 피보나치 비율로 나눔으로써 생성됩니다. %. 이러한 수준이 식별되면 수평선이 그려지고 가능한지지 및 저항 수준을 식별하는 데 사용됩니다.
피보나치 되돌림은 일반적으로 목표를 달성하는 데 사용되며, 가까운 시일 내에 달성 될 수 있습니다. 그것은 가능성있는 목표를 해독하는 데 도움이 될뿐만 아니라 주식에 대한 가능한 저항 및 지원 수준을 나타내는 데 중요한 역할을합니다.
골든 비율로 알려진 61.8 %가 주목됩니다.
피보나치 되돌림은 패턴 또는 추세선 구분과 함께 사용하면 대상, 지원 및 저항 세 가지를 결정하는 데 크게 도움이됩니다.
피보나치 가격 전망은 피보나치 비율을 사용하여 가격 변동을 분석하고 잠재적지지 및 저항 수준을 식별하는 또 다른지지 및 저항 지표입니다. 그러나 피보나치 가격 되돌림 및 가격 확장과는 다른 방향으로 이전 가격 변동과 관련하여 현재 가격 변동에 대한 비례 연구를 수행한다는 점에서 다릅니다.
일부 차트 응용 프로그램에는이 도구에 피보나치 확장이라는 레이블이 붙어 있습니다.
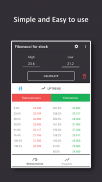
어떻게 사용 되나요?
피보나치 투영법의 적용은 두 가지 가격 파가 필요하다는 점에서 다른 연구들과 다릅니다 : 초기 파와 반대 방향의 완료 파. 피보나치 가격 예측은 카운터 트렌드 이동의 끝에서 예상됩니다.
피보나치 예측을 사용할 때 기술 분석가는 시장이 돌아 오기를 기다린 다음 마지막 이동 이전의 가격 변동에 피보나치 예측 비율을 적용합니다. 이 연구는 마지막 가격 변동의 끝에서 예상됩니다. 여기에는 세 가지 포인트가 필요합니다. 이전 스윙 하이 및 스윙 로우 다음에 다운 트렌드에서 또 다른 스윙 하이가 이어 지거나, 이전 스윙 로우 및 스윙 고가 다음에 상승 트렌드에서 또 다른 스윙 로우가 이어집니다. 피보나치 비율은 다운 트렌드에서 스윙 하이 투 스윙 로우에 적용되어 다음 스윙 하이에서 상승하거나, 스윙 로우에서 스윙 업에서 상승 경향은 하이 스윙에서 하이 스윙에 적용되어 다음 스윙 로우에서 투사됩니다. 그런 다음이 레벨에서 수평선이 그려지고 가능한지지 또는 저항 레벨로 사용됩니다.
Fibonacci for stock - APK 정보
APK 버전: 3.0.2패키지: amrmohamed.fibonaccistockcalculatorFibonacci for stock의 최신 버전
다른 버전들


동일 카테고리의 앱


좋아할 만한 것...


